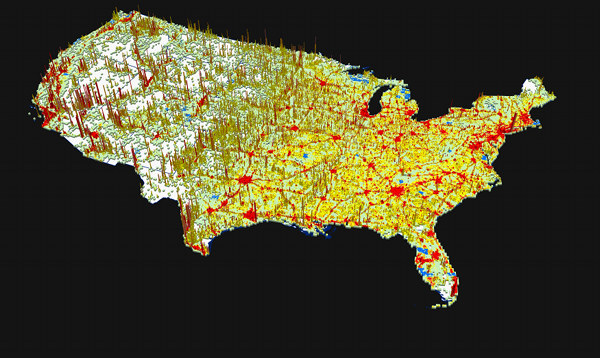
This 3-D visualization represents projected changes in U.S. population between 2010 and 2050 as predicted by a new Oak Ridge National Laboratory model. Areas seen in red indicate higher levels of population growth, whereas the vertical spikes signify population growth with new land development. (Image courtesy ORNL)
Researchers at Oak Ridge National Laboratory have developed a population distribution model that provides unprecedented county-level predictions of where people will live in the United States in the coming decades.
Initially developed to assist in the siting of new energy infrastructure, the team’s model has a broad range of implications from urban planning to climate change adaptation. The study is published in the journal Proceedings of the National Academy of Sciences.
“We do a census every 10 years because those data help us do long-term socioeconomic planning,” said Budhendra Bhaduri, who leads ORNL’s Geographic Information Science and Technology group. “Population projection numbers are important, but many pressing societal needs also require an understanding of where people are going to be. This has always been a challenge; we’ve never had a good method to make future projections spatially explicit.” [Read more…]
