
By 2100, Knox County could have 20-80 more days when the maximum temperature is above 95 degrees Fahrenheit, according to climate data used by the City of Knoxville and developed with help from Oak Ridge National Laboratory and NOAA Climate Explorer.
By 2100, Knox County could have 20-80 more days when the maximum temperature is above 95 degrees Fahrenheit, according to climate data used by the City of Knoxville and developed with help from Oak Ridge National Laboratory.
The additional 20 days with a high over 95 is considered the best-case scenario. That would be almost three more weeks of high temperatures.
The 80 more days with a high over 95 would be a worst-case scenario. That would be close to three more months of high temperatures.
The higher and lower number of days appear to be correlated with, or caused by, higher and lower emissions.
There could be some variability in the temperature increases from year to year, but the overall trend would be up, according to the data, which used the NOAA Climate Explorer. (NOAA is the National Oceanic and Atmospheric Administration.)
An animated image based on the data shows projected changes from 2011 to 2050 in an eight-county region, including Knox and Anderson. Overall, there would be a general increase in the number of days with a maximum temperature above 95 degree Fahrenheit, compared to a 1981-2005 average. There could be some variability by location, even between counties. You can the animated image here:Â ORNL Climate Data Summary Movie. (The movie moves quickly through the slides after the animation; you can find a PDF version of those slides in the link at the end of this article.)
Erin Gill, director of sustainability for the City of Knoxville, said the impacts are regional, but in its data, the city focused on Knox County.
The climate data for Knox County shows an expected increase in the need for air conditioning, a measurement known as cooling degree days.
The data also shows a decrease in the number of days in Knox County when the minimum temperature would fall below 32 degrees Fahrenheit. By 2100, there could be 30 to 55 fewer days when the minimum temperature is below 32.
The changes could result in reduced demand for heat in the winter and increased demand for air conditioning in the summer.
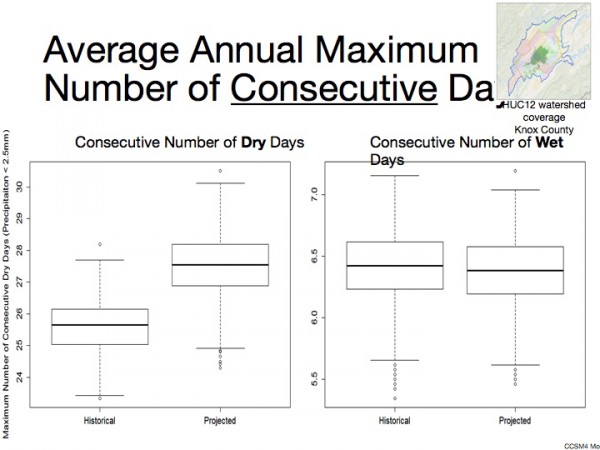
The climate data also show a projected increase in the average annual maximum number of consecutive dry days. However, there is more uncertainty in the precipitation models than in the temperature models, Gill said.
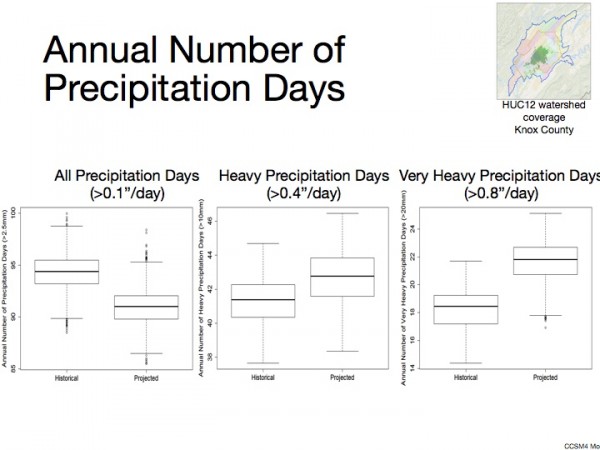
According to precipitation data from ORNL, which has a Climate Change Science Institute, Knox County could have fewer “all precipitation days,” when precipitation exceeds 0.1 inch per day. But the county could have more heavy precipitation days (more than 0.4 inch per day) and very heavy precipitation days (more than 0.8 inch per day).
Winters and summers are both expected to be warmer and wetter.
A warmer atmosphere holds more moisture, Gill said. Knox County might not always have more rainfall, but it could be more intense, even if the total rainfall amount remains the same.
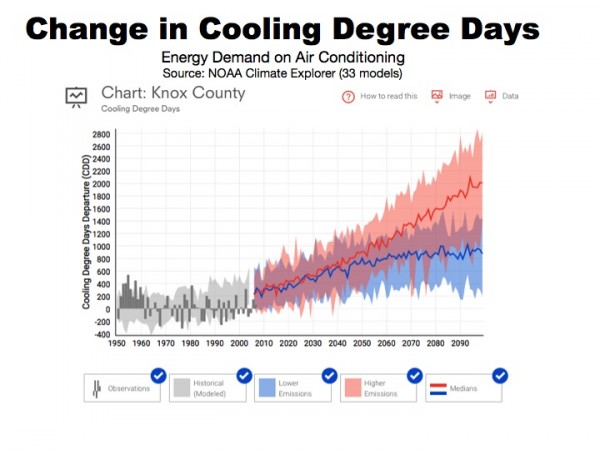
Image courtesy City of Knoxville, which had help from Oak Ridge National Laboratory. Cooling degree days is a way to measure the need for air conditioning, and it incorporates temperatures and the number of days.
Gill said more intense rains could be followed by dry spells. The area could experience more periods of intense heats, Gill said.
One question that officials are considering is how to help low-income families who might save money on heating bills in the winter but spend more on air conditioning during hot summer months. It’s not clear what the net difference would be or whether low-income families would be able to save the money from lower utility bills in the winter to use for higher bills in the summer.
Among the potential impacts: More and new pests are possible as winter temperatures get warmer because the survivability of pests would change with fewer days below freezing, Gill said.
She said Knoxville is using the climate data as part of its hazard mitigation planning process. That’s part of a Federal Emergency Management Agency, or FEMA, process. Knoxville is using the information to assess vulnerabilities and risks, and consider the severity of the consequences of those risks as officials prepare for the future, Gill said.
She said the data helps with urban forestry, helping to determine which trees to plant and where while thinking about future temperatures and precipitation levels. Some trees could be pushed out of range, Gill said.
She said there are immediate opportunities with energy efficiency projects that make sense today and could have compounded benefits in the future.
Here are the expected climate change impacts by sector, according to the climate data summary:
Warmer and wetter summer
- Heat-related health and infrastructure impacts
- Increased extreme weather events (floods, tornadoes, etc.)
- Reduced labor productivity
- Increased energy use and utility costs
- Increased allergens and pollutants (including ozone)
- More frequent days above air quality regulatory levels
- Increased and new pest populations
- Unwanted spread of non-native species
- Reduced agricultural productivity
Warmer and wetter winter
- Increased extreme weather events (ice, floods, etc.)
- Decreased energy use and utility costs
- Increased allergens and pollutants (including ozone)
- Increased and new pest populations
- Unwanted spread of non-native species
You can see the ORNL Climate Data Summary here:Â ORNL Climate Data Summary.
More information will be added as it becomes available.
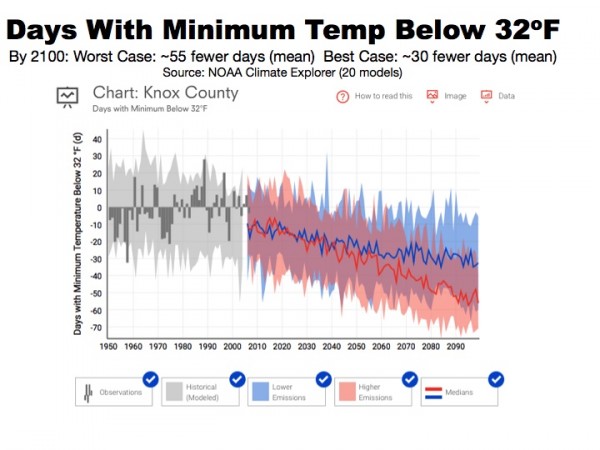
By 2100, there could be 30 to 55 fewer days in Knox County when the minimum temperature is below 32 degrees Fahrenheit, according to climate data used by the City of Knoxville and developed with help from Oak Ridge National Laboratory and NOAA Climate Explorer.
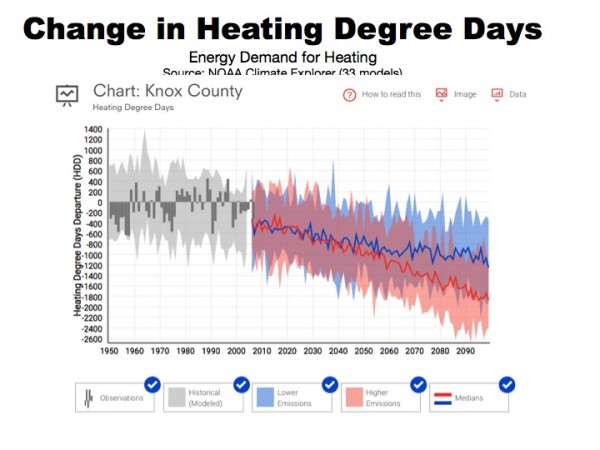
Image courtesy City of Knoxville, which had help from Oak Ridge National Laboratory. There could be a reduced demand for heat in the winter.
Do you appreciate this story or our work in general? If so, please consider a monthly subscription to Oak Ridge Today. See our Subscribe page here. Thank you for reading Oak Ridge Today.
Copyright 2017 Oak Ridge Today. All rights reserved. This material may not be published, broadcast, rewritten, or redistributed.


Leave a Reply